
Boost Conversions: Google Analytics Landing Page Optimization
Introduction: The Designer’s Edge in Data-Driven Conversions
As Visual Thinkers, we instinctively understand the power of aesthetics and emotional connection. But what if we could elevate our designs from merely beautiful to truly effective, driving tangible business results? This is where the magic of Google Analytics landing page optimization comes into play. It’s about blending your creative prowess with undeniable data, transforming visitor behavior into actionable design improvements. For designers, this isn’t just a trend; it’s the new frontier, a way to prove the immense value of thoughtful, data-backed visual communication.

Bridging the Gap: Design Intuition Meets Analytics
For too long, design and analytics have operated in separate silos. Designers rely on intuition, aesthetics, and user empathy, while analysts delve into numbers and spreadsheets. The modern landscape demands a symbiotic relationship. Visual Thinkers now have the opportunity to harness data to validate creative choices, identify pain points, and sculpt experiences that not only resonate visually but also compel users to act.
This integration of data-driven insights ensures that every pixel and placement serves a strategic purpose. It’s about moving beyond assumptions to create truly optimized designs that deliver measurable outcomes. We’re not just making things look good; we’re making them perform exceptionally.
Decoding Google Analytics: Essential Metrics for Designers
Understanding Google Analytics is no longer optional for designers focused on conversion. It’s a core skill. By delving into key metrics, Visual Thinkers can uncover the ‘why’ behind user interactions and transform those insights into powerful design adjustments. Forget the jargon; let’s focus on what truly matters for your design work.


Understanding User Behavior Through Visual Data
Google Analytics provides a window into user behavior on your landing pages. Metrics like bounce rate tell you how many users leave after viewing only one page, often indicating immediate disengagement with your initial design. A high bounce rate could point to unclear messaging, an unattractive visual layout, or a mismatch between ad copy and page content.
Similarly, exit rate highlights the last page users view before leaving your site. If a particular step in a conversion path has a high exit rate, it suggests a design flaw or a confusing element on that specific page. Understanding engagement time and scroll depth helps determine if users are truly interacting with your content or merely skimming it. These numerical insights paint a vivid picture of how your visual choices are perceived.
Identifying Conversion Bottlenecks with Analytics
The beauty of Google Analytics lies in its ability to pinpoint where users drop off in their journey. Conversion paths mapping visually illustrates the steps users take (or fail to take) towards a goal, such as a purchase or a form submission. By analyzing these paths, designers can identify exact points of friction.
Perhaps users are getting stuck on a particular form field, or a crucial piece of information is hidden. These bottlenecks are prime opportunities for design intervention. Real-time analytics, a recent development, further allows for immediate design adjustments, enabling agile optimization and rapid prototyping based on current user interactions.
Strategic Design for High-Converting Landing Pages
Armed with analytics, Visual Thinkers can move beyond generic best practices to implement truly strategic design. This involves meticulously crafting every element to guide the user towards conversion, turning insights into impactful visual experiences. Let’s explore how design becomes a conversion powerhouse.
Visual Hierarchy and Call-to-Action (CTA) Optimization
A clear visual hierarchy is paramount for effective Google Analytics landing page optimization. It directs the user’s eye, ensuring the most important information, like your unique selling proposition and call-to-action (CTA), stands out. Designers must use size, color, contrast, and negative space strategically to create a natural flow.
CTAs, in particular, are the gateways to conversion. Their design – button shape, color, text, and placement – can significantly impact click-through rates. Experimenting with compelling imagery near CTAs can further draw attention and reinforce the desired action. Think of your design as a subtle, visual conversation leading users to the next logical step.
The Psychology of Color and Typography in Conversions
Color psychology plays a profound role in influencing user emotions and actions. Different colors evoke different feelings; for instance, blue often conveys trust, while red can signify urgency. Typography, too, impacts readability and brand perception. A clear, legible font choice enhances user experience, while a well-chosen headline font can grab attention.
By understanding your target audience and the message you want to convey, Visual Thinkers can select color palettes and font pairings that not only align with brand identity but also strategically nudge users toward conversion goals. This isn’t just about pretty visuals; it’s about making psychological connections through design.
Mobile-First Design: A Conversion Imperative
In today’s digital landscape, a significant portion of traffic originates from mobile devices. This makes mobile-first optimization not just a best practice, but a conversion imperative. Landing pages must be designed to be responsive, load quickly, and offer an impeccable user experience on smaller screens.
Visual clarity and ease of navigation are crucial on mobile. This means simplifying layouts, optimizing image sizes, and ensuring CTAs are easily tappable. Neglecting mobile design can lead to high bounce rates and lost conversions, regardless of how stunning your desktop version appears.
Implementing A/B Testing and Iterative Design
Intuition gets you started, but data-driven iteration refines your work to perfection. A/B testing is a powerful tool for Visual Thinkers to validate design hypotheses and continuously improve landing page performance. It’s how we move from good designs to great ones, backed by empirical evidence.
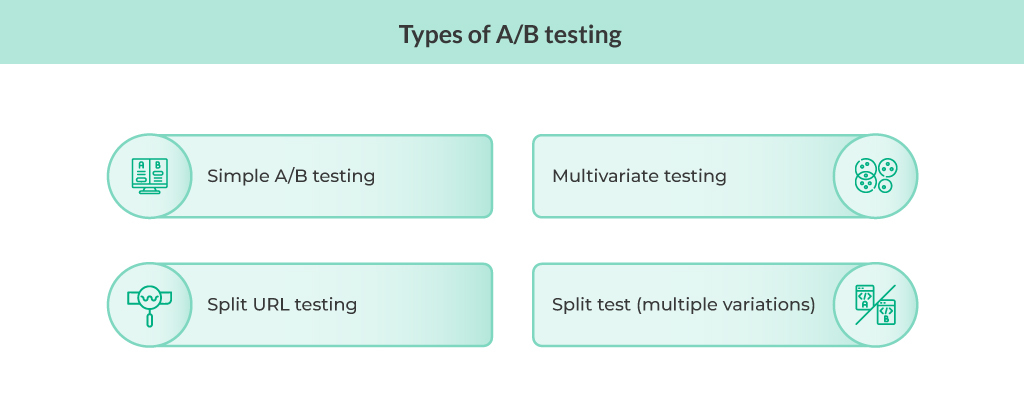
Designing for Experimentation: Visual Variations
A/B testing involves creating two or more variations of a landing page element to see which performs better. As designers, this means crafting compelling visual alternatives for headlines, images, CTA buttons, form layouts, or even entire sections. Each variation is a hypothesis about what might resonate more effectively with your audience.
The key is to test one significant change at a time to isolate its impact on conversion rates. This systematic approach allows you to iterate and refine your designs based on real user responses, rather than relying solely on guesswork. AI tools are increasingly aiding this process, generating rapid prototypes for A/B testing ideation.
Analyzing Test Results to Refine Design
Once your A/B tests are running, Google Analytics becomes indispensable for interpreting the results. You’ll track metrics like conversion rate, bounce rate, and engagement time for each variation. A statistically significant difference indicates a clear winner, guiding your design decisions.
Analyzing these results isn’t just about picking the best performer; it’s about understanding why it performed better. Did a bolder CTA color increase clicks? Did a different hero image improve engagement? These insights build a repository of knowledge, continually enhancing your ability to create high-converting landing pages.
Tools and Technologies for Enhanced Optimization
The modern design and marketing ecosystem offers an array of tools that empower Visual Thinkers to excel in Google Analytics landing page optimization. From seamless software integration to cutting-edge AI, these technologies bridge the gap between creative vision and data-driven results.
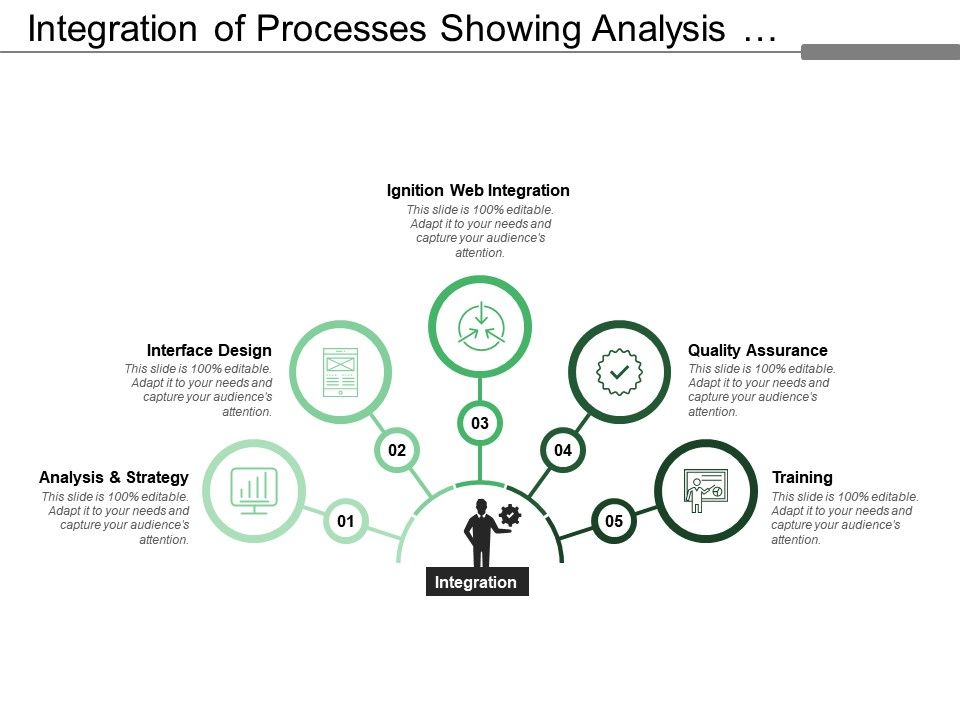
Integrating Design Software with Analytics Platforms
The ability to integrate your design tools with analytics platforms streamlines the optimization process. While direct integrations can be complex, many design platforms offer plugins or export options that facilitate the transfer of assets for A/B testing platforms like Google Optimize (though Google Optimize is being sunsetted, the principle of integration remains with other tools). This allows for rapid deployment of design variations and real-time performance tracking.
Furthermore, understanding how your chosen CMS (like WordPress) integrates with Google Analytics ensures that conversion tracking is set up correctly from the outset. This foundational integration is crucial for collecting accurate data to inform your design decisions.
AI-Powered Design Insights and Personalization
Recent trends show a strong emphasis on AI-powered tools that offer sophisticated data interpretation and personalization capabilities. These tools can analyze vast datasets from Google Analytics, identify patterns, and even suggest design modifications for improved conversion. They can predict which design elements might resonate best with specific audience segments.
AI also facilitates creating highly personalized landing page experiences, tailoring content and visuals based on user demographics, behavior, and preferences. This level of dynamic optimization, driven by AI insights, allows designers to achieve unprecedented conversion rates by delivering precisely what each user needs.
Case Studies: Real-World Landing Page Conversion Success
The theories of Google Analytics landing page optimization come alive with real-world examples. Seeing how data-driven design has transformed underperforming pages into conversion champions is the ultimate proof of its power. These case studies inspire Visual Thinkers to apply these principles to their own projects.
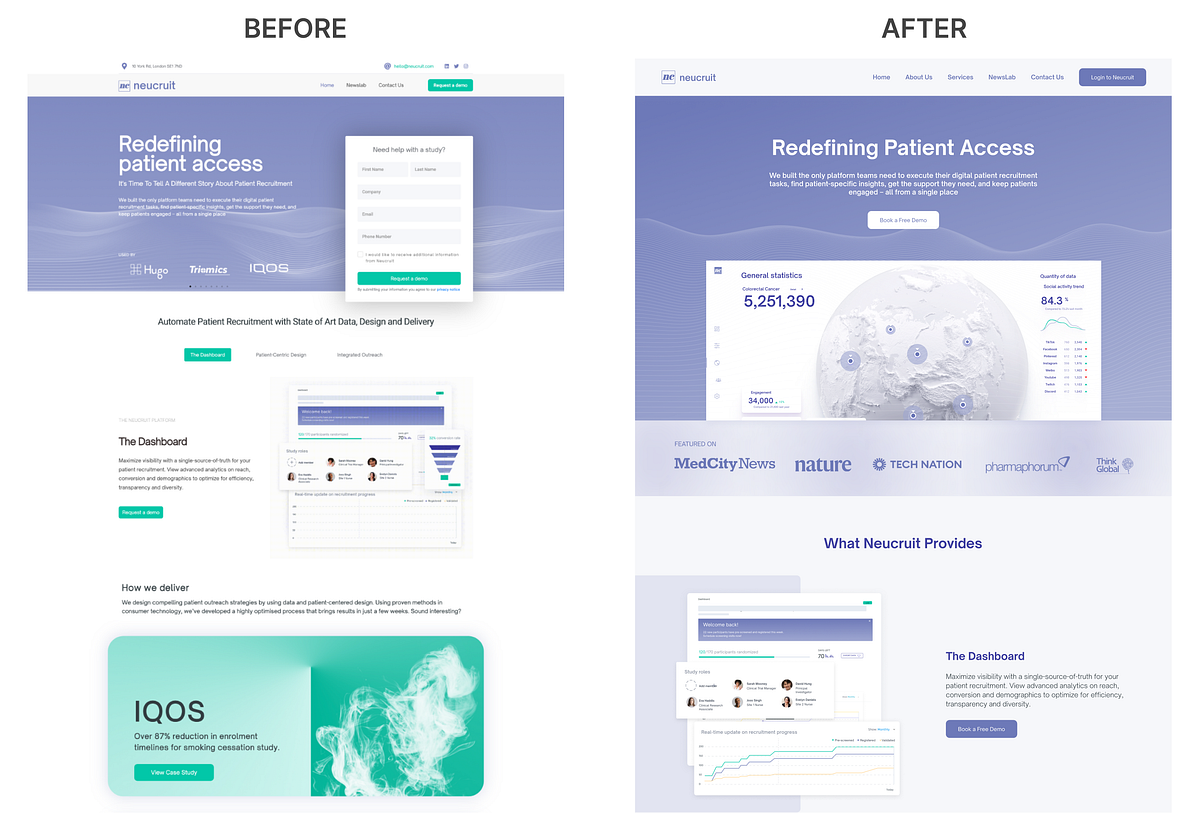
Before & After: Visualizing Data-Driven Design Impact
Imagine a landing page with a high bounce rate. Google Analytics data reveals users are not scrolling past the hero section. A designer, armed with this insight, redesigns the hero: a more engaging image, a clearer value proposition, and a prominent CTA above the fold. The result? A significant reduction in bounce rate and a surge in conversions.
Another example might involve optimizing a checkout page. Analytics show users abandoning their carts at the shipping information step. A design adjustment simplifying the form, adding trust badges, and reducing visual clutter leads to a dramatic improvement in completion rates. These ‘before and after’ scenarios vividly demonstrate the direct impact of data-informed design on the bottom line.
Future Trends: The Evolving Landscape of Design and Analytics
The synergy between design and analytics is continuously evolving. As Visual Thinkers, staying ahead of these trends ensures our skills remain sharp and our designs remain impactful. The future promises even more sophisticated ways to harness data for creative excellence.
We can expect to see even deeper integration of AI for predictive analytics, allowing designers to anticipate user needs and behaviors before they occur. Real-time data will become even more granular, empowering immediate, hyper-personalized design adjustments. The focus on micro-conversions throughout the entire user journey will intensify, requiring designers to optimize every tiny interaction.
Moreover, updated conversion rate benchmarks for various sectors will continue to provide designers with current industry standards, ensuring their goals for Google Analytics landing page optimization are not only realistic but also competitive. The landscape is dynamic, and our ability to adapt our creative process with data will define success.
Visual Conclusion: Crafting Conversion Masterpieces with Google Analytics
For Visual Thinkers, mastering Google Analytics landing page optimization is about more than just numbers; it’s about understanding the human story behind the data. It’s about translating abstract metrics into compelling visual narratives that guide, engage, and ultimately convert. By embracing analytics, we elevate our craft, transforming designs into powerful engines of growth.
As creative professionals, we understand the importance of making an impact. If you’re seeking to elevate your brand through strategic design, impactful digital marketing, or engaging social media campaigns, Cipta Visual is here to help. We blend creativity with strategy to tell your unique story.
Ready to transform your online presence with a website that truly performs? Our professional WordPress website creation services offer modern design, robust SEO optimization, and unparalleled reliability & customization. We build digital foundations that not only look stunning but are also engineered for maximum conversion. Let’s create something extraordinary together. Reach out to us for a consultation or to learn more about our solutions: Email Cipta Visual or explore our services at Cipta Visual Digital Solutions.
Dive Deeper: YouTube Recommendations for Visual Thinkers
To further sharpen your skills in data-driven design and Google Analytics, here are some valuable YouTube resources:
Sources & References for Visual Thinkers
The insights in this article are drawn from extensive experience and reputable sources dedicated to digital marketing, design, and analytics. For further reading and to deepen your understanding, consider exploring resources from Google for Developers (Google Analytics), and Google Search Central’s Image SEO Best Practices.
Written with insights from Cipta Visual — helping Visual Thinkers blend creativity, strategy, and storytelling to build stronger brands.
Discover more from CiptaVisual
Subscribe to get the latest posts sent to your email.
